Another day, another whiteboard
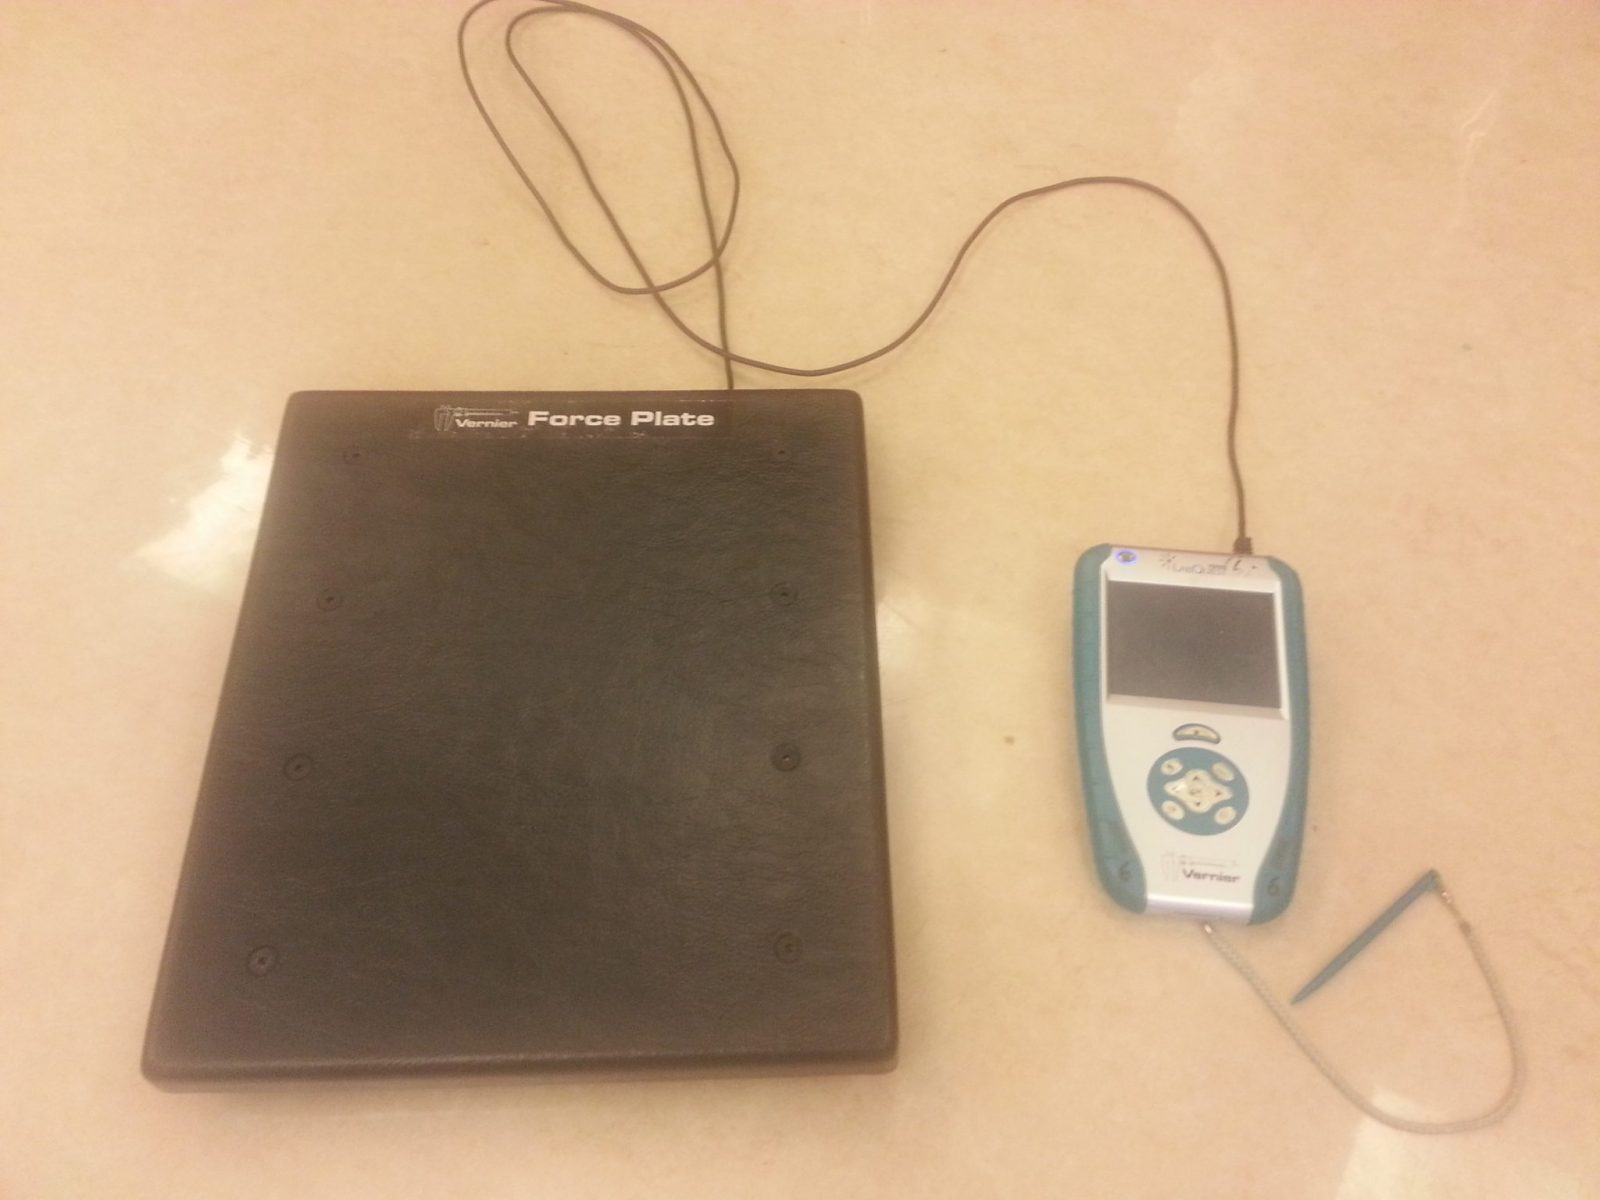
 Today we did a lab where we examined the variables in the swinging of a pendulum. We changed the length of the string, the mass of the pendulum, and the angle it was released from. We recorded the period (time) for each trial. I won’t spoil it and give you the results, so you can try it yourself if you want. We learned more good ways to do this introductory lab. My group’s white board is to the right.
When we finished with the lab, the next part was looking at ways of introducing non-linear graphs to students. The basic technique is students are provided with non-linear equations (y=k/x, y=kx^2, y=kx^(.5), etc.) and asked to graph them. After graphing them, they are asked to explain what is the slope and y-intercept mean in each.
After this, students are given non-linear data that they graph and go “ack, I can’t make a linear equation (y=mx+b) from this.” They are then asked to look at the graphs they just made and determine if their new graph looks like one of them. They match it to the closest graph, then take the independent variables in their data and process them according to the equation of the matched graph (e.g. square, take the square root, take the inverse). They then graph that data and tada it forms a nice linear graph. They can then write the equation for this new line.