“You can’t put something on the final we haven’t seen!!!”
Today as a finals review “warm up” (although it ended up taking the whole period) I presented the students with four beakers of water: One with ice, one at room temp, one on a hot plate “low” (about 37C) and one boiling. I used Logger Pro to show the four temperatures on a projector screen (a sensor in each beaker). I asked them to use the skills they have learned in this class to analyze the relationship between temperature in F and in C. Half the class I told to set C as the IV, half F as IV.

One student in particular was emphatic that “it’s not fair to put something on the final that we haven’t done in class.” I told him and the class that they have the skills to analyze this relationship, even if they haven’t seen it, and told them that applying their knowledge in a new situation shows real understanding. I said that the final will contain mostly the type of physics problems we’ve been working on, but that there will be one relationship that they haven’t seen before. (I use Modeling Instruction curriculum that focuses on analyzing experimental data to develop physics concepts/models.)
I gave them a couple minutes to write down the temperatures in C, then switched the readings to F. One student pointed out that the temperatures readings kept changing. I agreed, and asked which digits seemed constant: All agreed that the “ones place” was constant. Since I don’t worry too much about sig figs in my class, I suggested that this might lead us to decide to round off to the ones place in their results.
The students settled down to work. Here’s what I noticed as I went around:
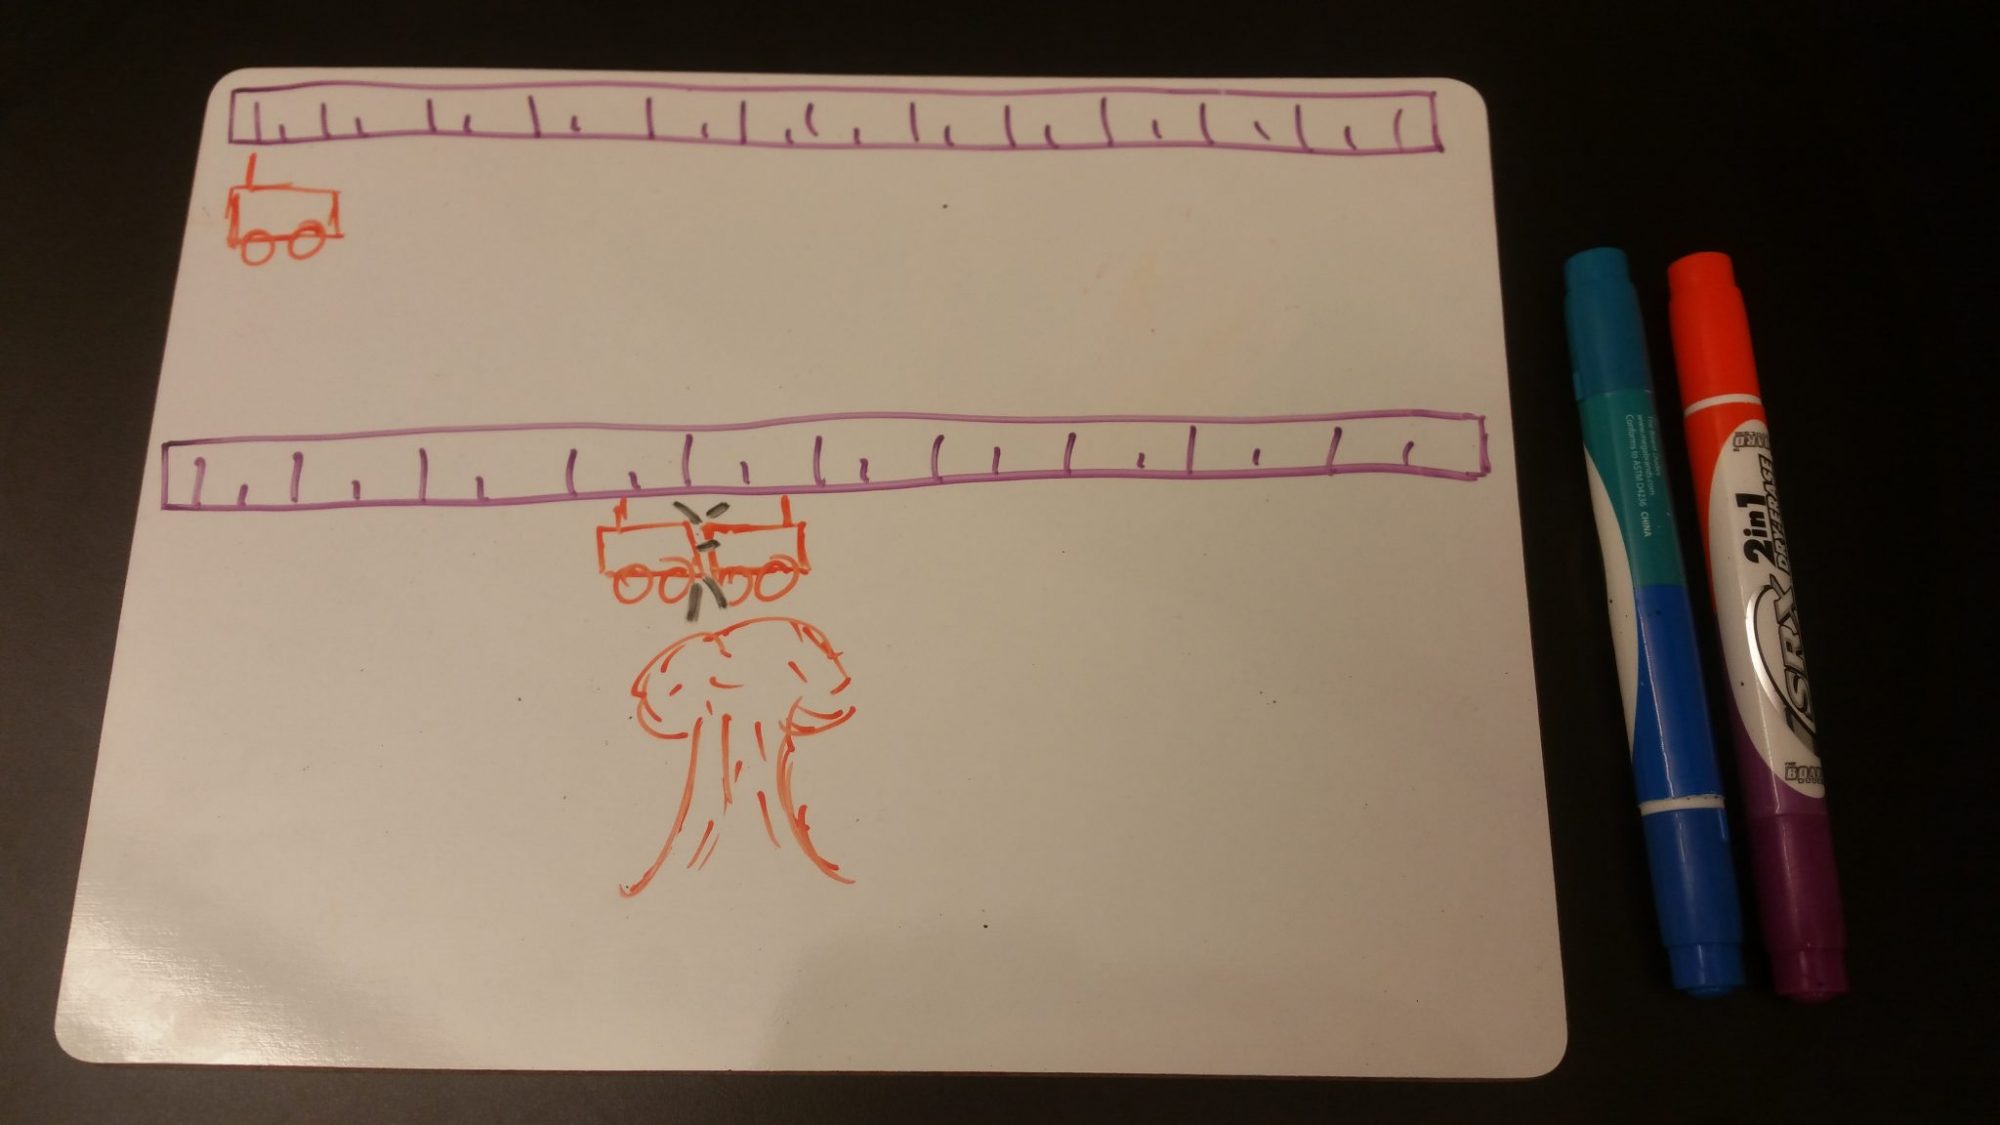
- I had the beakers labeled 1, 2, 3, 4. Some of the students put 1, 2, 3, 4 as the IV (even though I had assigned each group what their IV should be). For the next period, I changed the labels to A, B, C, D and confusion did not appear.
- My students use TI graphing calculators for processing data. They first create a graph of the data, then decide if the relationship looks linear or quadratic. I found a couple groups that were doing quadratic regressions instead of linear, and upon talking with them they admitted that they used quadratic regression “because the DV numbers were so large compared to IV.” However, their “a” value (in y=ax2+bx+c) was in the 10-5 range. We discussed that this number was so small compared to the others, that it could be considered zero, and when we looked at their “b” and “c” values, they matched the y=ax+b values that other groups got.
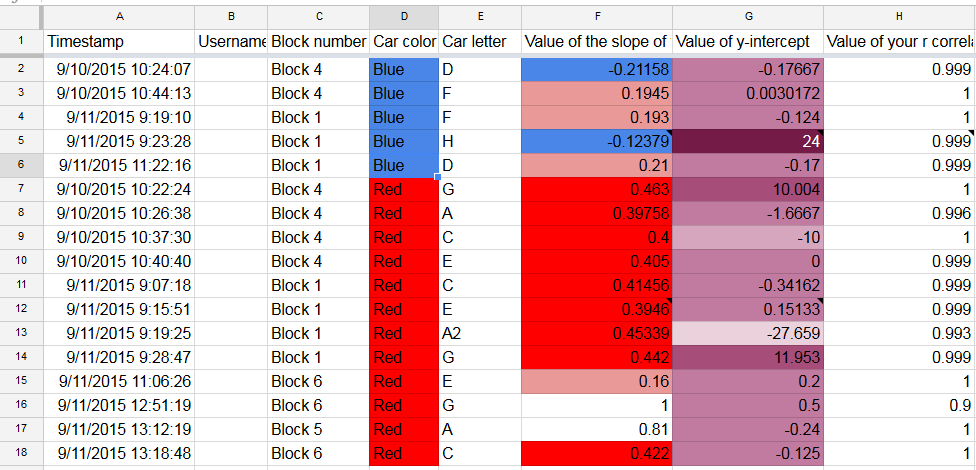
When we did whiteboard presentations, we first looked at those with degrees C as the IV. I asked my students who had completed chemistry (not all have) if they remember the conversion equation, and a couple in each class did. They give the “F=(9/5)C + 32” solution. I then asked them what 9/5 is in decimal, and, tada, it’s 1.8 which is the slope they got in their equations.
When rounded to two sig figs, almost all groups got 1.8 and 32 for slope and y-intercept (a couple got ± 1).

I then said, “So this equation is great for us Americans who go to a foreign country and need to convert from C to F. But what about foreigners who come here and want to convert from F to C?” I then rearranged the equation (probably should have had them do it, but was short on time), and the results were the slope and y-intercept the “T F is IV” group got.

At the end I asked how many felt comfortable that they had successful at analyzing this relationship, and most were positive about it.
It was a good day!
Lee


This is a really clever experiment. Nice job.
Wow! Truly interesting!