Bouncing Ball Lab Introduces Models and Foreshadows Future Physics Concepts
Update: April 2019: I completed a seven page document that contains this post and a bit more. You can download a PDF here. This document includes NGSS correlation with Science & Engineering Practices (HS-ETS1-2 and HS-ETS1-3) and Crosscutting Concepts (HS-PS2-2).
I use this lab as an introduction to my physics class at all levels: First year and AP. The goal of the lab is to introduce students to the role of physics in making predictions, and for me to see where they have strengths and weaknesses in lab procedures and data analysis.
The Challenge
Students are presented with a variety of balls and a meterstick. They are challenged to develop a method of determining how high their ball will bounce if dropped from 1.5 meters and from five meters.

Experimental Design
- Students spend about ten minutes with their lab group discussing their design.
- After this, a class-wide discussion helps generate:
- “Rules” around what is fair (e.g. you can’t measure the height of a table, then place the meterstick on the table to get 1.5 meters–but congratulate any group that develops this or similar “illegal” procedure as being creative!)
- Some class-wide practices (we’ll all drop on the floor so everyone has a similar bounce surface).
- Demonstration that there are different ways to approach the challenge.
Goals of discussion
In the class discussion, the goals are:
- Students define the “Independent variable” as the drop height, and the “Dependent variable” as the bounce height.
- Develop a “best practice” of collecting ten data points to analyze:
- Some groups will say “bounce it from 1 meter and from 0.5 meters, then add them.” I usually show two points on a graph, then draw a straight line through them and a parabola through them, and ask which trend is the best predictor.
- Students may suggest using camera phones to record the height of the bounce—work out with your students what you will accept—but be open to accept creativity.
- Here is where you can be more “inquiry” or “guided inquiry,” e.g. do you want to develop procedures that we want many (10?) data points, and/or many trials for each height (3?), or have that come out as groups share their experimental designs in their whiteboards. I prefer the “best practice” of three trials for each of ten initial conditions.
- It is important to bring up in the discussion where on the ball the group is going to record from. Some may want to record from the top of the ball, some from the bottom. It is best not to force either way upon them, but to allow each group to determine and record where they will be measuring from. The location of the measurement will not affect the slope of their graph, but will affect the y-intercept. Allowing for different groups to use different measuring points will allow this to be revealed in the whiteboard meeting. (Hint: If you measure from the top of the ball, how high will the ball bounce if you drop the ball from zero…and can you drop the ball from zero?)
General experimental design
- Most students will develop an experiment that involves dropping the ball from 1.0 meters, 0.9 meters, 0.8, etc.
- Three trials at each drop height ensures accuracy of measurement.
- Students are told that the accuracy of their prediction will be part of their grade, so they should be careful with their measurements!
Data analysis
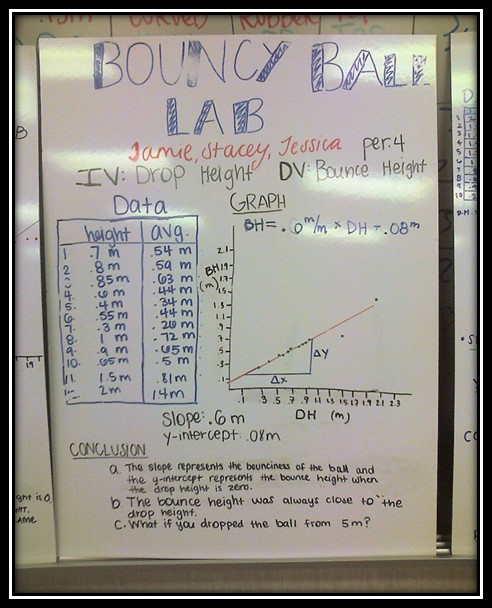 After conducting their experiment, each group analyses their data by plotting a graph, then presents their analysis to the class on a whiteboard. Results include:
- Shape of graph.
- Slope of graph.
- Y-intercept.
In the “Board meeting,” the class develops the meaning of each of these concepts.
Each group then determines a predicted bounce heights.In determining their bounce height, students are encouraged to use both their graph (find 1.5 m on the horizontal axis, go up to the line, then go over to the vertical axis) and their equation (input 1.5 and find the answer).
Once we finish the discussion, we are ready for the testing!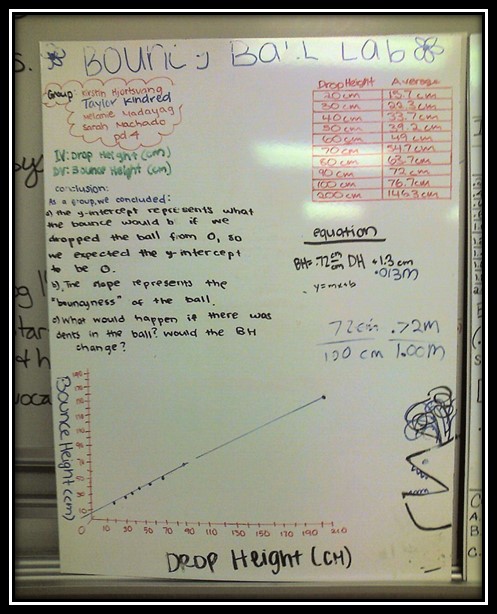
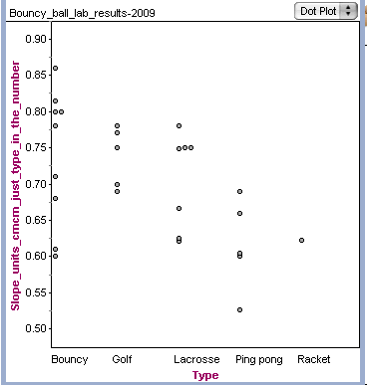
Graphing
Here are a couple of computer generated graphs. The one on the left shows one group’s results, while the one on the right shows the slope of each type of ball (I have students turn in as homework via the internet their slope and type of ball, so I can put the results from all my classes on the same graph).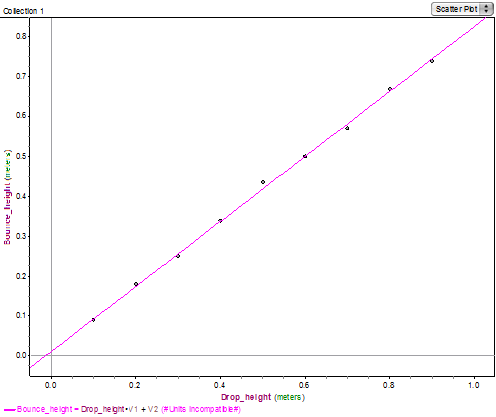
Testing:
1.5 meter challenge
- I have two metersticks taped together, and each group brings up their ball for the test.
- Students find that their prediction matches their results, usually within 10%. (Depending on the level of your class, you can have them calculate a “percent error” or simply have them calculate their prediction as a percent of their actual.)
5 meter challenge
- We then go out to our courtyard with a stairwell where students line up to observe the height of the bounce. This presents an opportunity to discuss parallax (whose eyes are most “lined up” with the bounce height). Finding a good location for your five meter challenge is important, you need a location where students can line up along the stairs so at least a few are near where the ball will rise to.
- I hang a tape measure with every meter marked off with blue tape, and every half-meter marked off with another color. This allows them to see where they line up on the tape, as they are likely to be too far away from it to be able to read the numbers.
- About half the groups find their prediction is not close to their results (their prediction is too high).
- Generally, it’s the balls with low density that have the worst results (usually a student notices this in the discussion, but be ready to prompt it if it does not come out).
Concluding discussion
- The first question I ask when we have our concluding discussion is “Would it be fair for me to grade you based on the 1.5 m drop?” The class generally says “Yes!” since they all got A’s on it.
- My next question is “Would it be fair to grade you on the 5 meter drop?” The answer is a resounding “No.”
- I inform them that their accuracy grade will only be based on the 1.5 m drop, and that those who got 90%+ accuracy get an A.
Moral of the story: Physics works.
- We then address the meaning of the slope and y-intercept:
- Since balls that “bounce high” have high slopes, we define the slope as the “bounciness” of the ball.
- The y-intercept is “how high the ball will bounce if dropped from 0 m.”
- This leads to discussion of experimental design: Most students get a y-intercept close to zero, but some students get a significant positive y-intercept. Usually, on examination of their procedures, it becomes clear that they were measuring from the top of their ball, and thus it physically impossible to drop from 0.0m–but there is still a mathematical y-intercept.
- We then discuss why the five meter challenge wasn’t successful. Students bring up different ideas:
- The floor outside is different (one year, after this variable was raised, I had a group to go back out and test the floor to determine this is not a problem).
- Air resistance must be playing a role.
- More energy is lost when the ball falls further.
- Most of these are left to “we’ll come back and look at this lab when we address these concepts later in the semester,” but some can be resolved right there. I had one group who went out with their ball and a meterstick to check to see if the floor was different, and proudly came back to say it was not.
Pedagogy
What I value most about this lab:
- It starts physics by presenting students with a challenge that they can successfully complete.
- It lets me see who is having difficulty with graphing before I get to the “real physics.”
- It introduces data analysis without introducing new physics concepts. It allows students to use their own language, which sometimes allows me to say “Many terms often mean something different in physics than in everyday language. Let’s leave the physics terms out of our discussion until we have defined them in class.”
- It creates a foundational experience that we can return to throughout the year.
Acknowledgements
I would like to thank the American Modeling Teachers Association and Arizona State University for their work in designing and training teachers in the use of a rich curriculum that develops thinkers rather than memorizers.

Great post–I will absolutely try this. Thank you!
I’m a physics teacher teaching computer programming this year. I will do this lab and others like it with an eye on the computer modeling aspects. Thanks!
I love this lab as an introduction to physics, especially since most of our students need help with graphing and understanding relationships between variables. We have worked this summer on a lab using kinematic equations, where the students determined the velocity of the ball short before it hits the floor, and shortly after it leaves the floor using drop height and bounce height. The next step would be to calculate the changes in energy of the ball and have the students determine what happens to the energy that seemingly “disappears” to include elastic potential energy in their thinking of conservation of energy.
Good idea. At the start of my physics classes, my students don’t understand energy yet, so I circle back to the bouncing ball lab when we get to energy, and look to answer the question about the “missing” energy.
Lee – Loved your analysis of the benefits of this lab! I did this one on the first day my first year teaching, but then learned of the Spaghetti Bridge Lab at my Modeling workshop. I’ve been using the bridge lab since, but you’ve almost convinced me to go back to the ball bounce. I appreciate the ease of predictability this lab offers (with spaghetti bridges, it would take too much weight to break a large number of pieces so we never test our predictions). Just curious, what kind of time frame does this whole process typically require (I have 81 minute classes)? Thanks!
Hi Amanda,
Sorry I didn’t see your comment/question earlier. I also teach with 80 minute blocks, and this takes about 2-3 class periods. The first class period includes presenting the challenge, developing the “all class” procedures, and then conducting the lab and gathering data. I usually ask them to graph their data for homework, but depending on your students’ graphing skills, they may or may not be able to complete this. The second day is analyzing the graphed data, and making predictions. If all goes well, you can test their predictions on the second day, but you might need to hold off on this until the third day. I think I usually get through the indoor 1.5 meter challenge, then have to do the 4-5 meter challenge the third day, as well as wrap up the lab with a whiteboard meeting for conclusions.
Thank you for sharing the bouncy ball lab! I plan on using it as my first lab.
I have followed your procedure and I have loved your description here.
I am hoping to do a presentation on the use of graphs in science classes and student difficulties. I would like your permission to refer to your material giving you the full credit that you so richly deserve
Hi Josephine,
Yes, you certainly may. I’d love to hear how your presentation goes.