180: Day 14: Evaluating data from all classes
I’m a big one on looking at large quantities of data. In each of my physics classes, I have seven to nine groups. In the Buggy Lab, that provides enough data that whiteboard sessions go fairly well, with:
- at 3-4 groups going in each direction
- two groups starting at extreme positive or negative locations
- three to four starting at medium locations
- two groups starting at zero
- three to five slow cars and three to five fast cars.
But that’s not enough for me 🙂
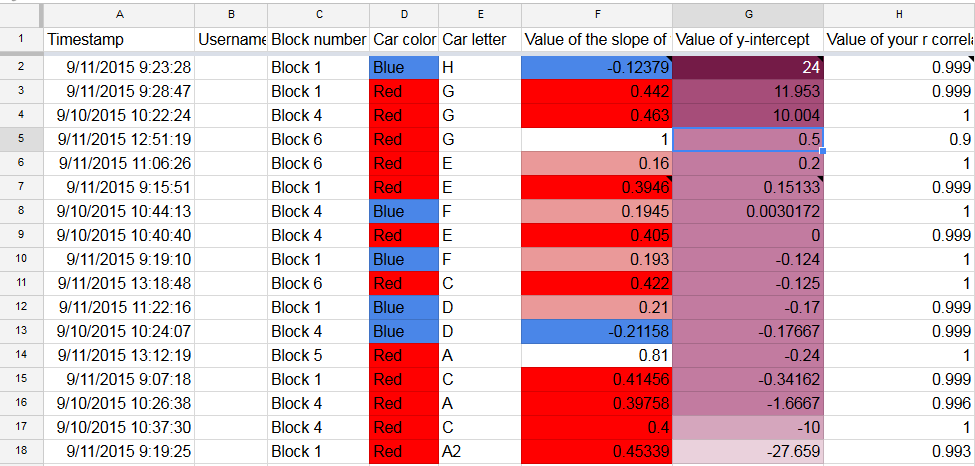
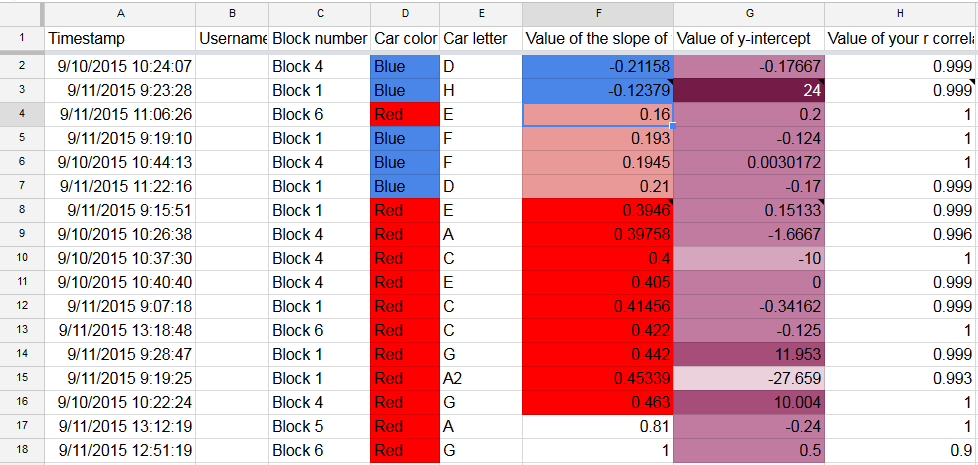
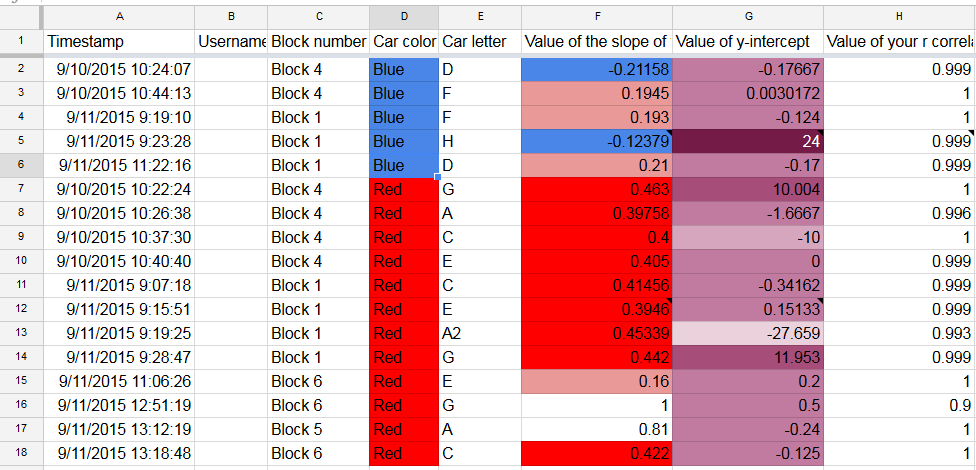
I have my students submit their calculated results to a Google spreadsheet, so we end up with around 30 different sets of results. When we have our whiteboard meetings, I’ll have the spreadsheet available if students want to look at more data (and, of course, I hint that this would be a good idea).
Here are some results from this year (homework is to complete it, so not everyone has posted yet). I use Format…Conditional formatting… rules to add color based on the values.
