June 30, 2021Death Valley geology hiking/camping trip Dec 2021Explore Death Valley with a group of hikers interested in examining the geology of the park. The trip is December 28, 2021 through January 1, 2022. Categories Geology/earthquakes/Science hikes Comments: 20
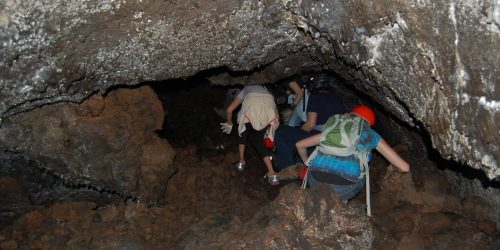
May 13, 2021Lava Beds & Tule Lake geology hiking/camping trip; July 2021Lava Beds & Tule Lake: July 11-14 Continuing our July northeast California trips, we will spend four days exploring Lava Beds National Monument, plus the Tule Lake National Monument. Katie and I are leading another hiking/camping trip with our Meetup group. If you would like to attend, space is limited so be sure to RSVP on Meetup here. The trip... Categories California History/Geology/earthquakes/Science hikes Comments: 0
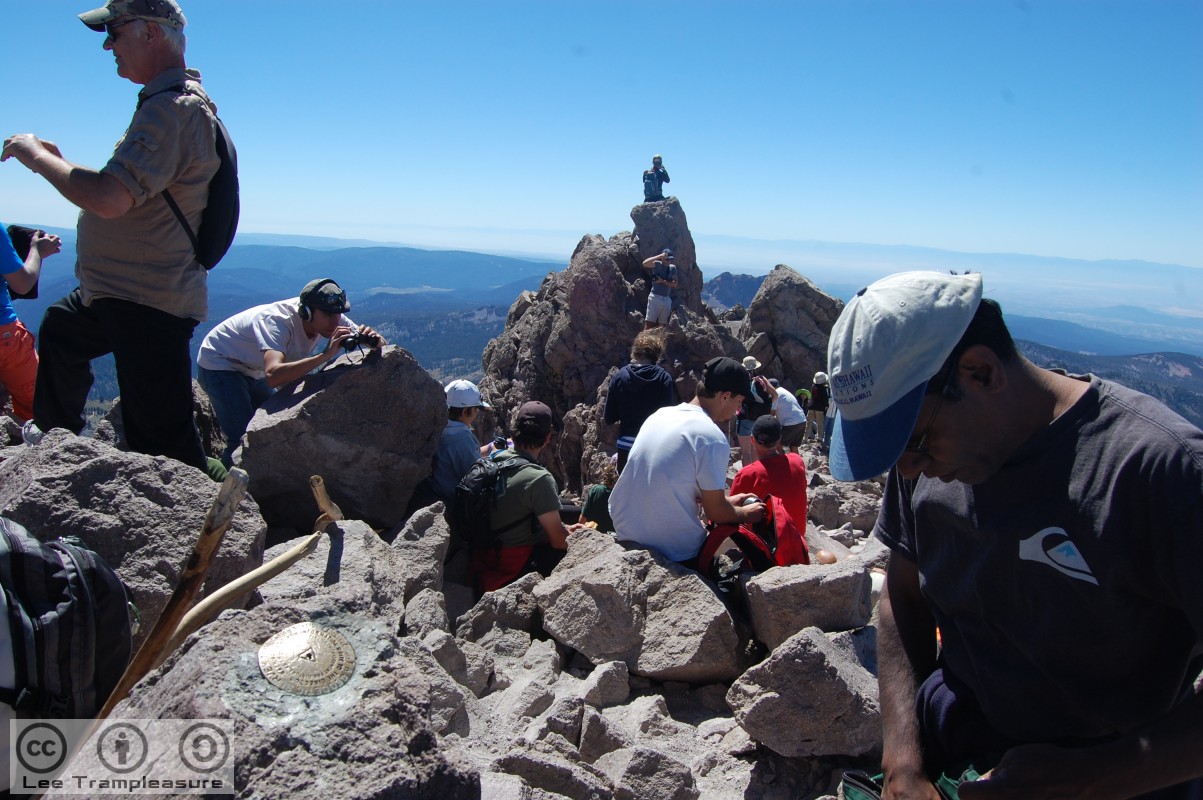
May 12, 2021Mt. Lassen and Lava Beds geology hiking/camping trip; July 2021Three-day geology focused hiking in the Mt. Lassen area in Northern California. Nights spent in a group campsite. Categories California History/Geology/earthquakes/Healthy living/Science hikes Comments: 0
April 15, 2020Death Valley online tour: COVID-19 social distancingUsing Google Earth as the tour map, and combining my knowledge from the trips I have taken there with my photos and YouTube/Vimeo videos, I organized an online tour for of Death Valley April 15th, 2020. Below are images and videos from that tour (I hope to add a Google Earth link soon). Categories Geology/earthquakes/Science Education/Science hikes Comments: 0
March 27, 2020Corona virus limerickCorona virus limerick Categories Healthy living/Humor/Life sciences Comments: 0
March 17, 2017How I generate science tutorial videosA tutorial on creating videos for science education (or any other instructional theme). Categories Computers and the web/Science Education Comments: 0
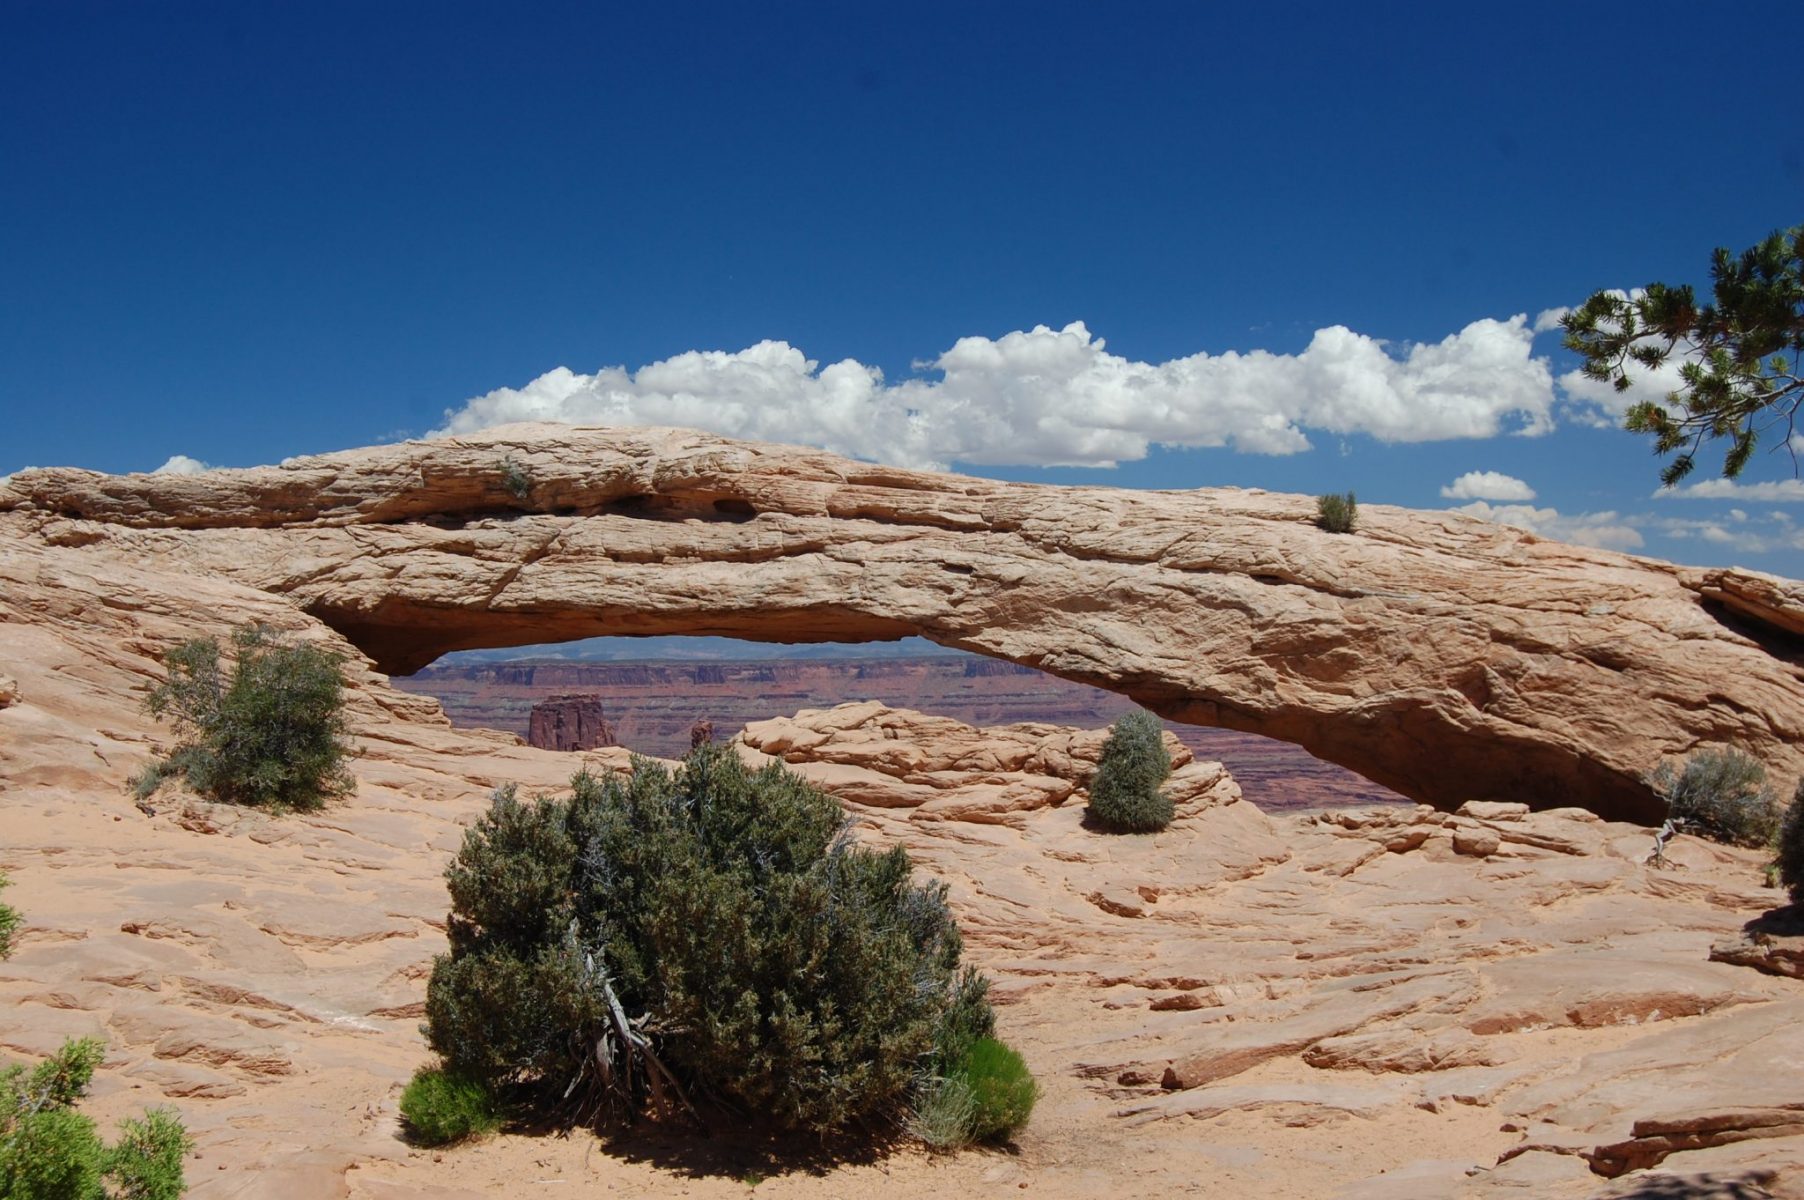
July 7, 2015Tentative geology road trip/hikes to Southwest, March 2016Katie and Ada and I had a great trip through the Southwest earlier this summer, and we’re thinking of doing a similar trip with our SF Bay Area Geology and Natural Sciences Hiking Group. The trip would run nine days, from Saturday, March 26th (early departure) through Sunday, April 3rd (late return), 2016. Unfortunately, this trip requires a lot of... Categories Geology/earthquakes/Science hikes Comments: 18
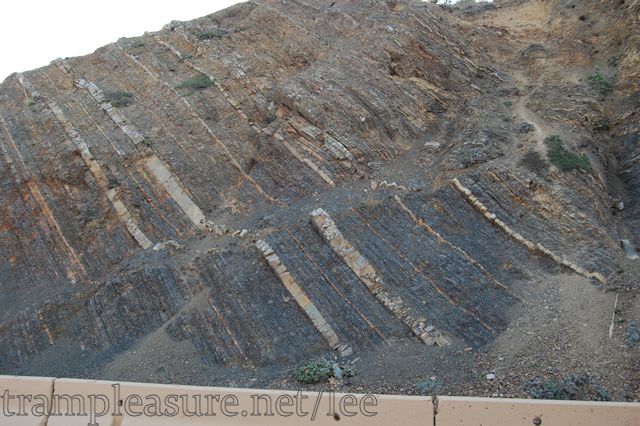
March 6, 2015Faulting at Devils SlideThe opening of the tunnel around Devil’s Slide in San Mateo County allowed for the creation of a mile-long trek to look at some of California’s fascinating geology. In my last geology hike to the trail, I took a photo of the great sedimentary layers at the north end of the trail, then edited the photo to show how well... Categories California History/Geology/earthquakes/Science hikes Comments: 4
December 7, 2009Hayward’s “D Street” fault creep, curb offset evidence erasedSadly, improvements in city streets can wipe out geologic evidence. D Street has been a great field trip stop to see earthquake fault creep, and appears in many guidebooks and web sites. But in 1997, Hayward repaved the road, including the sidewalks (they all needed it). When they repaved it, they straightened all the curb lines, thereby erasing the evidence... Categories Geology/earthquakes Comment: 1
August 8, 2007Into North DakotaI made it across the Mississippi today! Guess that means I’m in “the West.” I crossed the Big Muddy where it isn’t so big, nor so muddy, in Brainerd, MN. If memory serves me right, Brainerd is the city where Marge Gunderson is from in the movie Fargo. Well, put a physics teacher behind the wheel of a car for... Categories Science Education/Summer 2007 Comments: 0