Correlations and Scatter Plots
After a couple of hand-graphs, my students use their TI 83/84 calculator for graphing. We set the calculators so they give an “R squared” correlation, which we often use to help determine which regression type (linear, quadratic, power) fits the data the best. Many of my students have a hard time understanding the nature of the correlation, and I have developed a presentation that I hope will help them.
The slideshow above advances every ten seconds, but feel free to click the link above to give yourself control over the timing.
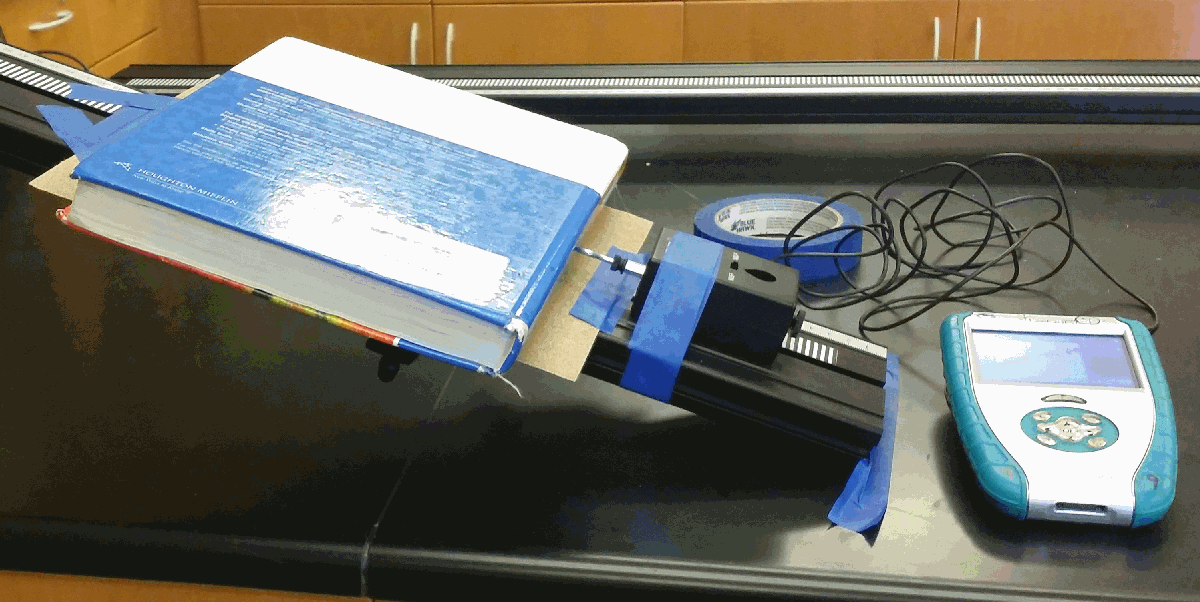
I looked at the chapter number and starting page in a physics book, and plotted these against each other. Turns out we get a real nice correlation, which should allow us to predict the starting page of any chapter (and also shows us that the number of pages in a chapter is fairly consistent). Then I plotted pages/chapter vs chapter number.
You can see the results here (in a Google slideshow): http://goo.gl/eRPeUm I haven’t answered all the questions in the presentation, I don’t want my student clicking on it to get the answer.


